Using Crowdsourcing to address Disparities in Police Reported Data: Addressing Challenges in Technology and Community Engagement
This is a project update from a CTSP project from 2017: Assessing Race and Income Disparities in Crowdsourced Safety Data Collection (with Kate Beck, Aditya Medury, and Jesus M. Barajas)
Project Update
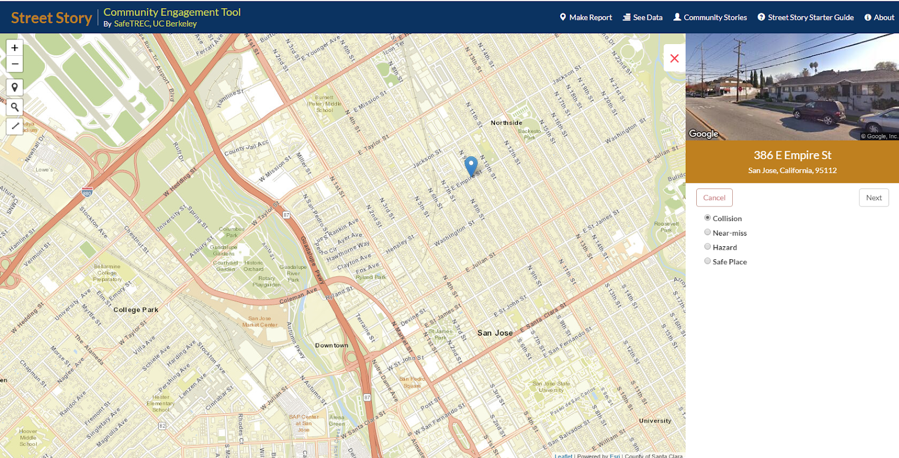
This work has led to the development of Street Story, a community engagement tool that collects street safety information from the public, through UC Berkeley SafeTREC.
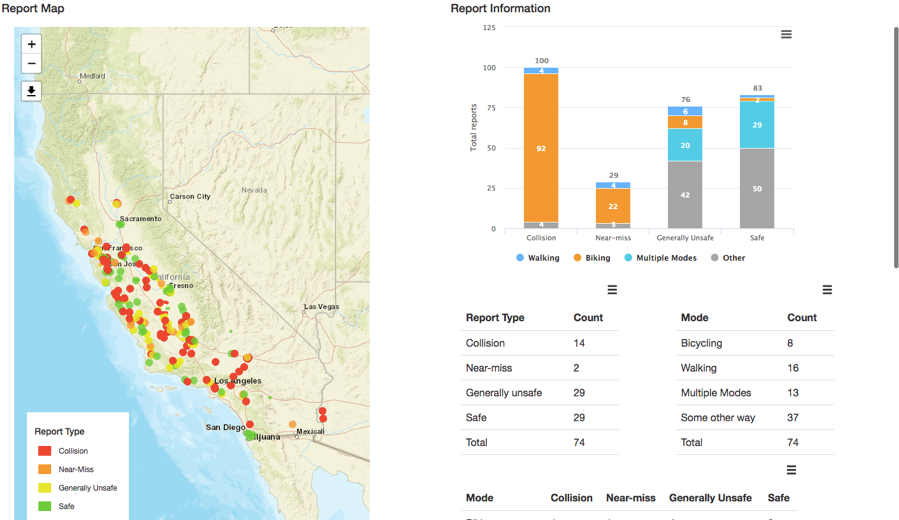
The tool collects qualitative and quantitative information, and then creates maps and tables that can be publicly viewed and downloaded. The Street Story program aims to collect information that can create a fuller picture of transportation safety issues, and make community-provided information publicly accessible.
The Problem
Low-income groups, people with disabilities, seniors and racial minorities are at higher risk of being injured while walking and biking, but experts have limited information on what these groups need to reduce these disparities. Transportation agencies typically rely on statistics about transportation crashes aggregated from police reports to decide where to make safety improvements. However, police-reported data is limited in a number of ways. First, crashes involving pedestrians or cyclists are significantly under-reported to police, with reports finding that up to 60% of pedestrian and bicycle crashes go unreported. Second, some demographic groups, including low-income groups, people of color and undocumented immigrants, have histories of contentious relationships with police. Therefore, they may be less likely to report crashes to the police when they do occur. Third, crash data doesn’t include locations where near–misses have happened, or locations where individuals feel unsafe but an issue has not yet happened. In other words, the data allow professionals to react to safety issues, but don’t necessarily allow them to be proactive about them.
One solution to improve and augment the data agencies use to make decisions and allocate resources is to provide a way for people to report transportation safety issues themselves. Some public agencies and private firms are developing apps and websites whether people can report issues for this purpose. But one concern is that the people who are likely to use these crowdsourcing platforms are those who have access to smart phones or the internet and who trust that government agencies with use the data to make changes, biasing the data toward the needs of these privileged groups.
Our Initial Research Plan
We chose to examine whether crowdsourced traffic safety data reflected similar patterns of underreporting and potential bias as police-reported safety data. To do this, we created an online mapping tool that people could use to report traffic crashes, near-misses and general safety issues. We planned to work with a city to release this tool to and collected data from the general public, then work directly with a historically marginalized community, under-represented in police-reported data, to target data collection in a high-need neighborhood. We planned to reduce barriers to entry for this community, including meeting the participants in person to explain the tool, providing them with in-person and online training, providing participants with cell phones, and compensating their data plans for the month. By crowdsourcing data from the general public and from this specific community, we planned to analyze whether there were any differences in the types of information reported by different demographics.
This plan seemed to work well with the research question and with community engagement best practices. However, we came up against a number of challenges with our research plan. Although many municipal agencies and community organizations found the work we were doing interesting and were working to address similar transportation safety issues we were focusing on, many organizations and agencies seemed daunted by the prospect of using technology to address underlying issues of under-reporting. Finally, we found that a year was not enough time to build trusting relationships with the organizations and agencies we had hoped to work with. Nevertheless, we were able to release a web-based mapping tool to collect some crowdsourced safety data from the public.
Changing our Research Plan
To better understand how more well-integrated digital crowdsourcing platforms perform, we pivoted our research project to explore how different neighborhoods engage with government platforms to report non-emergency service needs. We assumed some of these non-emergency services would mirror the negative perceptions of bicycle and pedestrian safety we were interested in collecting via our crowdsourcing safety platform. The City of Oakland relies on SeeClickFix, a smartphone app, to allow residents to request service for several types of issues: infrastructure issues, such as potholes, damaged sidewalks, or malfunctioning traffic signals; and non-infrastructure issues such as illegal dumping or graffiti. The city also provides phone, web, and email-based platforms for reporting the same types of service requests. These alternative platforms are collectively known as 311 services. We looked at 45,744 SeeClickFix-reports and 35,271 311-reports made between January 2013 and May 2016. We classified Oakland neighborhoods by status as community of concern. In the city of Oakland, 69 neighborhoods meet the definition for communities of concern, while 43 do not. Because we did not have data on the characteristics of each person reporting a service request, we made the assumption that people reporting requests also lived in the neighborhood where the request was needed.
How did communities of concern interact with the SeeClickFix and 311 platforms to report service needs? Our analysis highlighted two main takeaways. First, we found that communities of concern were more engaged in reporting than other communities, but had different reporting dynamics based on the type of issue they were reporting. About 70 percent of service issues came from communities of concern, even though they represent only about 60 percent of the communities in Oakland. They were nearly twice as likely to use SeeClickFix than to report via the 311 platforms overall, but only for non-infrastructure issues. Second, we found that even though communities of concern were more engaged, the level of engagement was not equal for everyone in those communities. For example, neighborhoods with higher proportions of limited-English proficient households were less likely to report any type of incident by 311 or SeeClickFix.
Preliminary Findings from Crowdsourcing Transportation Safety Data
We deployed the online tool in August 2017. The crowdsourcing platform was aimed at collecting transportation safety-related concerns pertaining to pedestrian and bicycle crashes, near misses, perceptions of safety, and incidents of crime while walking and bicycling in the Bay Area. We disseminated the link to the crowdsourcing platform primarily through Twitter and some email lists. . Examples of organizations who were contacted through Twitter-based outreach and also subsequently interacted with the tweet (through likes and retweets) include Transform Oakland, Silicon Valley Bike Coalition, Walk Bike Livermore, California Walks, Streetsblog CA, and Oakland Built. By December 2017, we had received 290 responses from 105 respondents. Half of the responses corresponded to perceptions of traffic safety concerns (“I feel unsafe walking/cycling here”), while 34% corresponded to near misses (“I almost got into a crash but avoided it”). In comparison, 12% of responses reported an actual pedestrian or bicycle crash, and 4% of incidents reported a crime while walking or bicycling. The sample size of the responses is too small to report any statistical differences.
Figure 1 shows the spatial patterns of the responses in the Bay Area aggregated to census tracts. Most of the responses were concentrated in Oakland and Berkeley. Oakland was specifically targeted as part of the outreach efforts since it has significant income and racial/ethnic diversity.
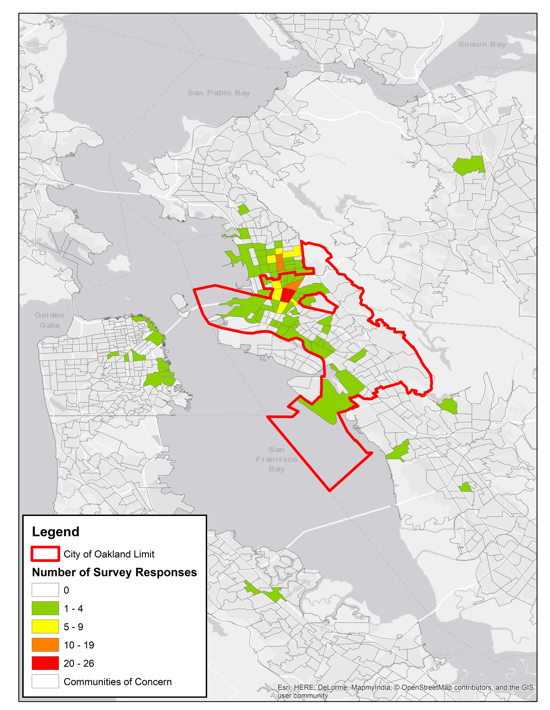
Figure 1 Spatial Distribution of the Crowdsourcing Survey Responses
In order to assess the disparities in the crowdsourced data collection, we compared responses between census tracts that are classified as communities of concern or not. A community of concern (COC), as defined by the Metropolitan Transportation Commission, a regional planning agency, is a census tract that ranks highly on several markers of marginalization, including proportion of racial minorities, low-income households, limited-English speakers, and households without vehicles, among others.
Table 1 shows the comparison between the census tracts that received at least one crowdsourcing survey response. The average number of responses received in COCs versus non-COCs across the entire Bay Area were similar and statistically indistinguishable. However, when focusing on Oakland-based tracts, the results reveal that average number of crowdsourced responses in non-COCs were statistically higher. To assess how the trends of self-reported pedestrian/cyclist concerns compare with police-reported crashes, an assessment of pedestrian and bicycle-related police-reported crashes (from 2013-2016) shows that more police-reported pedestrian/bicycle crashes were observed on an average in COCs across the Bay Area as well as in Oakland. The difference in trends observed in the crowdsourced concerns and police-reported crashes suggest that either walking/cycling concerns are greater in non-COCs (thus underrepresented in police crashes), or that participation from among COCs is relatively underrepresented.
Table 1 Comparison of crowdsourced concerns and police-reported pedestrian/bicycle crashes in census tracts that received at least 1 response
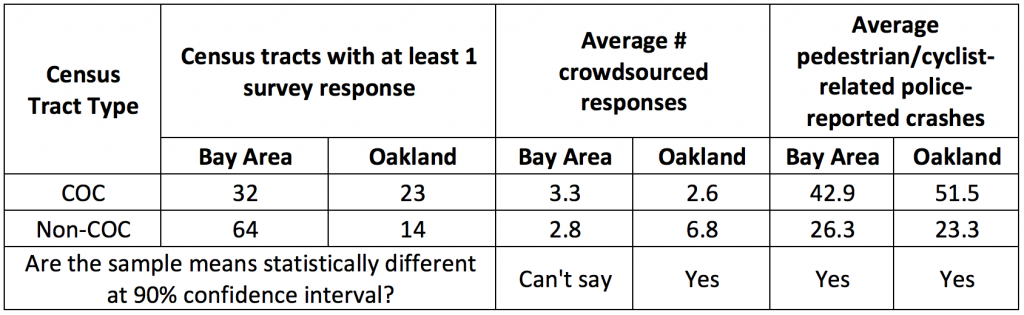
Table 2 compares the self-reported income and race/ethnicity characteristics of the respondents with the locations where the responses were reported. For reference purposes, Bay Area’s median household income in 2015 was estimated to be $85,000 (Source: http://www.vitalsigns.mtc.ca.gov/income), and Bay Area’s population was estimated to be 58% White, per the 2010 Census, (Source: http://www.bayareacensus.ca.gov/bayarea.htm).
Table 2 Distribution of all Bay Area responses based on the location of response and the self-reported income and race/ethnicity of respondents
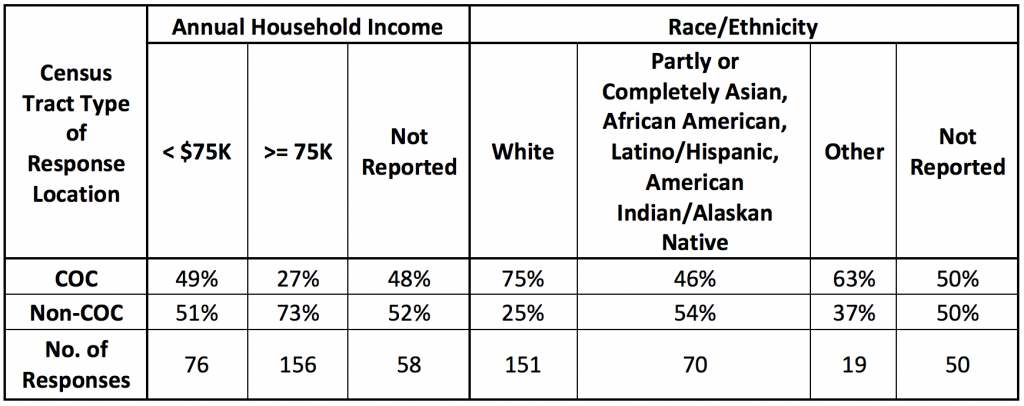
The results reveal that White, medium-to-high income respondents were observed to report more walking/cycling -related safety issues in our survey, and more so in non-COCs. This trend is also consistent with the definition of COCs, which tend to have a higher representation of low-income people and people of color. However, if digital crowdsourcing without widespread community outreach is more likely to attract responses from medium-to-high income groups, and more importantly, if they only live, work, or play in a small portion of the region being investigated, the aggregated results will reflect a biased picture of a region’s transportation safety concerns. Thus, while the scalability of digital crowdsourcing provides an opportunity for capturing underrepresented transportation concerns, it may require greater collaboration with low-income, diverse neighborhoods to ensure uniform adoption of the platform.
Lessons Learned
From our attempts to work directly with community groups and agencies and our subsequent decision to change our research focus, we learned a number of lessons:
- Develop a research plan in partnership with communities and agencies. This would have allowed us to ensure that we began with a research plan in which community groups and agencies were better able to partner with us on, and this would have ensured that the partners were on board the topic of interest and the methods we hoped to use.
- Recognize the time it takes to build relationships. We found that building relationships with agencies and communities was more time intensive and took longer that we had hoped. These groups often have limitations on the time they can dedicate to unfunded projects. Next time, we should plan for this in our initial research plan.
- Use existing data sources to supplement research. We found that using See-Click-Fix and 311 data was a way to collect and analyze information to add context to our research question. Although the data did not have all demographic information we had hoped to analyze, this data source added additional context to the data we collected.
- Speak in a language that the general public understands. We found that when we used the term self-reporting, rather than crowdsourcing, when talking to potential partners and to members of the public, these individuals were more willing to consider the use of technology to collect information on safety issues from the public as legitimate. Using vocabulary and phrasing that people are familiar with is crucial when attempting to use technology to benefit the social good.
No Comments